1.1 Climate Change
1.1 Climate Change
This chapter discusses the link between climate change and green hydrogen. It
highlights the importance of green hydrogen as a sustainable energy
carrier and explores its potential in reducing greenhouse gas emissions.
Consequences of climate change
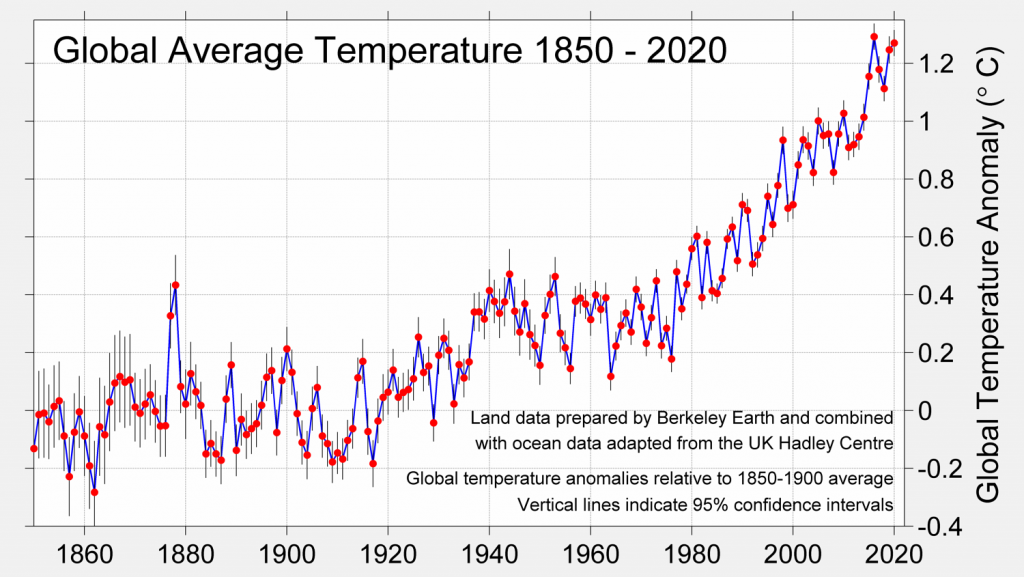
Considering the last 100 years, a global average temperature rise of about 1 °C can be observed. In 2010, the global annual average temperature was 1 °C above the pre-industrial temperature level for the first time. Since 2014, the average deviation never fell below 1 °C. The highest deviations were registered in 2016 and 2020 and ranged between plus 1.2 and 1.3 °C compared to pre-industrial times.
In the grafic below the exponential increase in temperature within the last 100 years can be comprehended. According to the state of scientific research on climate change, which is regularly compiled, assessed and published by the Intergovernmental Panel on Climate Change (IPCC), there is no natural explanation for this sudden change. On the contrary, the overwhelming majority of renowned climate researchers agree that the global warming of recent decades is almost exclusively attributable to human activities.

- Glaciers are shrinking worldwide
- The Alpine glaciers have already lost two thirds of their volume between 1850 and 2010.
- Ice sheets on Greenland and Antarctica are shrinking
- Summer Arctic sea ice cover decreased from 7.5 million square kilometres in 1982 to 3.5 million square kilometres in 2012
- Sea level increase by an average of 3.1 mm/year since 1993 due to thermal expansion of water in the oceans, glacier and ice sheet melting, in the twentieth century 17 cm in total
- Increasing frequency of extremes in weather
- Heavy precipitation (e.g. rainfall)
- The ten year moving average of the occurrence of events which resulted in flood losses in Europe rose from 3 per year in 1900 to 18 per year in 2016
- Extreme temperatures (e.g. number of days in Germany with temperatures above 30 °C increases by about 1.25 days per decade under consideration of the trend line)
- Droughts (since the 1970s not only the frequency but also the intensity increased)
- Heavy precipitation (e.g. rainfall)
- Tropical cyclones increased in intensity since the 1970s
- The ten year moving average of the number of Atlantic tropical cyclones which caused significant losses on the US mainland increased from 1.2 in 1970 to 4.2 in 2005, implying that the intensity and/or the frequency of these events increased